Frequency variations
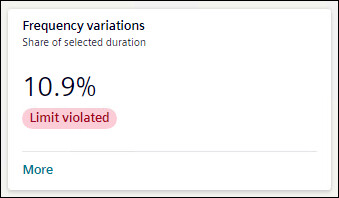
Frequency variations tile shows the percentage of hours frequency variation occurred over the selected timeline. The tile shows the status of frequency variation as All Ok, Warning, or Limit Violated as per Grid code EN 50160.
To view further details of frequency variations, click More.
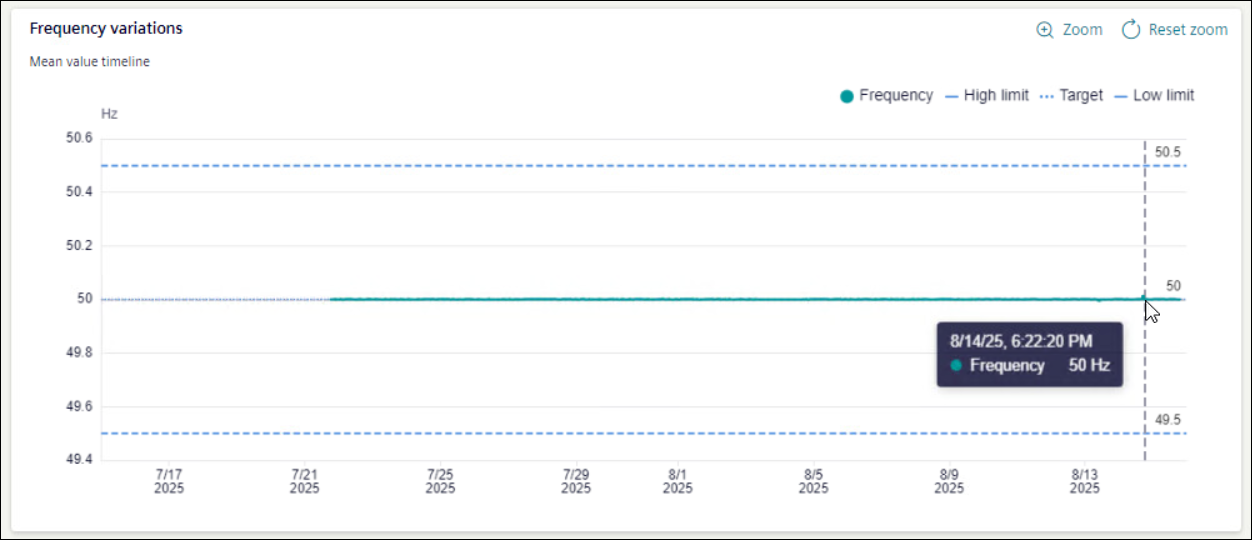
For Frequency variations graph, X-axis shows selected timeline and Y-axis shows magnitude of frequency. Hover mouse on the frequency to get more details.
Values of Operational value, Upper Limit, and Lower Limit are shown as a horizontal line on the graph.
NOTE: Operational value is based on device configuration.