Flicker severity
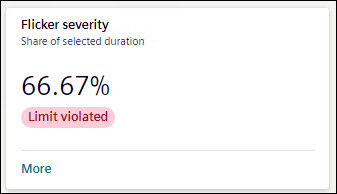
Flicker severity tile shows the percentage of hours flicker severity occurred over the selected timeline. The tile shows the status of flicker severity as All Ok, Warning, or Limit violated as per Grid code EN 50160.
To view further details of Flicker Severity, click More.
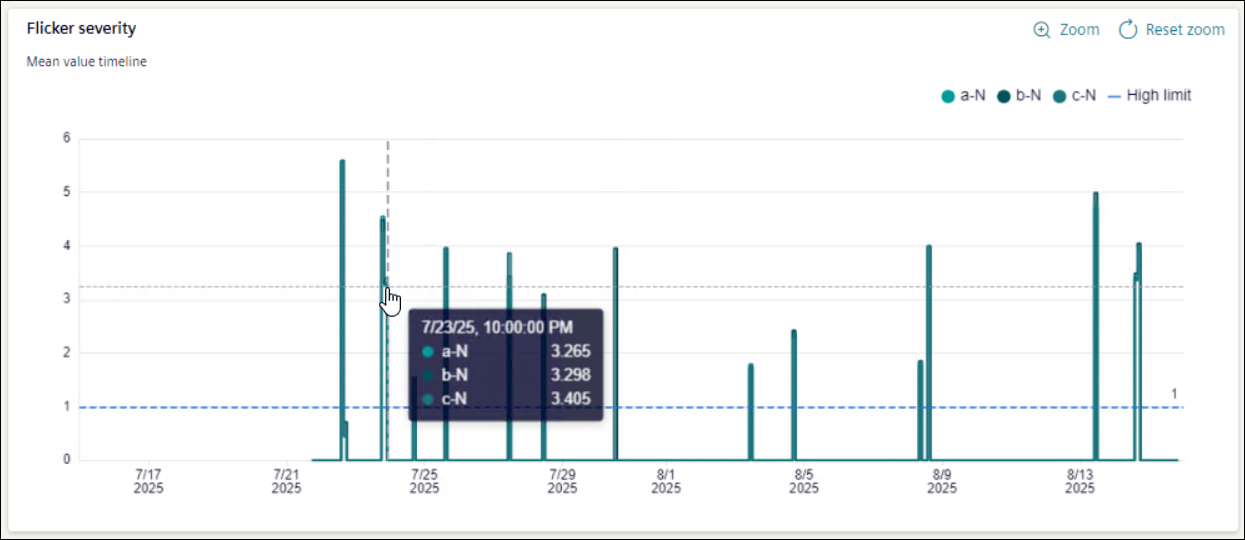
For Flicker Severity graph, X-axis shows selected timeline and Y-axis shows magnitude of flicker.
Hover mouse on the graph to get details for flicker.